1. Introduction
1.1 The Rise of DEI as a Business Imperative
Diversity, Equity, and Inclusion (DEI) have shifted from being peripheral ethical goals to strategic business imperatives. Today’s workplaces are more global, multicultural, and multigenerational than ever before. This transformation has led organizations to recognize that fostering inclusive environments is not just the right thing to do—it directly influences innovation, performance, and employee engagement. Studies by McKinsey & Company, Deloitte, and Harvard Business Review consistently show that diverse organizations outperform their less diverse peers in areas ranging from decision-making to profitability. Inclusion is no longer optional—it is essential to organizational growth and sustainability.
Moreover, employees, customers, investors, and regulators are demanding greater transparency around DEI efforts. Social movements such as #MeToo and Black Lives Matter have amplified public awareness of systemic biases and discrimination in the workplace. Consequently, companies must now demonstrate measurable, meaningful progress—not just release polished diversity statements. The pressure to back DEI promises with real data has never been greater.
1.2 Role of Data in Driving DEI Progress
Data has become the cornerstone of meaningful DEI initiatives. Where earlier strategies relied on anecdotal feedback or general observation, today's organizations seek evidence-based insights. DEI analytics empowers companies to identify disparities, track progress over time, and create targeted interventions. By measuring representation, retention, promotion, and pay equity across various demographics, data helps leaders move from intent to impact.
However, using data in DEI isn’t just about counting people—it’s about understanding people. True equity emerges when analytics reveal how individuals experience workplace systems differently based on their race, gender, age, disability status, sexual orientation, and other intersecting identities. Data-driven DEI transforms ideals into actionable strategies by offering objective insights into subjective realities.
1.3 Limitations of Traditional Metrics
Despite the progress made in adopting DEI analytics, most organizations still rely heavily on simplistic and surface-level metrics—especially averages. Reporting that "40% of the workforce is female" or that "minority representation increased by 5%" offers little insight into how different employee groups fare within the organization. Are women of color represented in leadership roles? Are LGBTQ+ employees retained at similar rates as their heterosexual peers? These nuances are often lost in traditional aggregate reporting.
Moreover, conventional metrics tend to focus narrowly on headcounts and ratios. They often ignore structural inequalities in hiring pipelines, pay grades, promotions, or access to developmental opportunities. Without digging deeper into the context and causes, traditional DEI metrics merely describe problems—they don’t explain them. They are good for dashboards, not for decision-making.
1.4 Why Granularity Matters in DEI Analytics
Granular insights are the antidote to oversimplification. They allow organizations to explore data at the intersectional level, distinguishing not just between broad categories (e.g., men vs. women) but among subgroups (e.g., Latina women in tech vs. White women in finance). Granularity uncovers the layered and complex ways in which people experience inclusion or exclusion.
When DEI analytics are disaggregated—by department, region, role, tenure, and identity—they provide visibility into where equity gaps truly lie. For example, a company might have equal gender representation at the entry level but a significant drop-off for women in senior roles. Without granular analytics, this drop-off would go unnoticed.
In short, granular data enables precision. It helps organizations target their interventions, measure what truly matters, and allocate resources effectively. It shifts the conversation from token representation to meaningful inclusion, and from assumptions to accountability.
2. Understanding DEI Analytics
2.1 What Is DEI Analytics?
DEI analytics refers to the systematic use of data to understand, measure, and improve diversity, equity, and inclusion outcomes within an organization. It is an extension of people analytics, focused specifically on tracking demographic trends, identifying bias, and designing interventions to create more inclusive workplaces.
At its core, DEI analytics uses both quantitative and qualitative data. Quantitative data includes statistics about hiring, promotions, compensation, engagement, and turnover—segmented by demographic categories. Qualitative data includes employee sentiment, focus group findings, and feedback from exit interviews.
The aim is to move beyond compliance-based tracking and use data to support strategic transformation. Instead of merely fulfilling legal reporting obligations (e.g., EEOC in the U.S. or diversity disclosures in India), organizations use DEI analytics to diagnose inequities, design equitable policies, and monitor real-time progress.
2.2 Key Metrics Used in DEI Measurement
DEI analytics typically covers a broad spectrum of metrics across various stages of the employee lifecycle. These include:
- Representation metrics: Proportion of employees across race, gender, disability status, age, LGBTQ+ identity, etc., segmented by role, level, and location.
- Recruitment funnel analysis: Who applies, who gets interviewed, who receives offers—analyzed for potential bias at each stage.
- Compensation equity: Pay gap analysis, including gender and race-based disparities across roles and grades.
- Promotion and advancement: Analysis of promotion rates across demographics to identify barriers to career progression.
- Attrition and retention: Turnover rates across groups, including reasons for leaving captured in exit interviews.
- Engagement and inclusion surveys: Employee feedback on inclusion, psychological safety, and sense of belonging.
These metrics, when tracked consistently and disaggregated by group, create a powerful foundation for identifying systemic inequities and measuring the success of DEI interventions.
2.3 Common Tools and Dashboards
Many organizations use HR Information Systems (HRIS), applicant tracking systems (ATS), and business intelligence tools to gather and visualize DEI data. Some of the widely used platforms and technologies include:
- Workday, SuccessFactors, BambooHR: For tracking demographic and employment data.
- Power BI, Tableau, Looker: For building custom DEI dashboards with disaggregated visualizations.
- DEI-focused analytics tools: Tools like Diversio, Syndio, and Gapsquare provide advanced DEI analytics, pay equity reports, and bias identification.
- Pulse survey platforms: CultureAmp, Glint, and Peakon help collect sentiment and inclusion metrics.
The key to effective DEI analytics isn’t just the tool—it’s how data is structured, who interprets it, and whether insights are translated into action.
2.4 Traditional Use of Aggregate Data
Historically, DEI data has been aggregated to show overall progress in broad categories. This includes year-over-year trends in minority representation, gender ratios in leadership, or total DEI hiring percentages. While useful for high-level reporting, these averages offer limited insights into real organizational dynamics.
For instance, a company may report that “30% of employees are from underrepresented groups,” but fail to reveal that most of them are concentrated in low-wage roles with little upward mobility. Similarly, data might show that men and women are paid equally overall, but mask a significant pay gap within specific teams or levels.
Aggregate data has another shortcoming—it doesn’t show progression or regression at different stages. It might highlight a surge in hiring women, but not account for an equally high attrition rate. In essence, it presents a static picture, not a dynamic narrative.
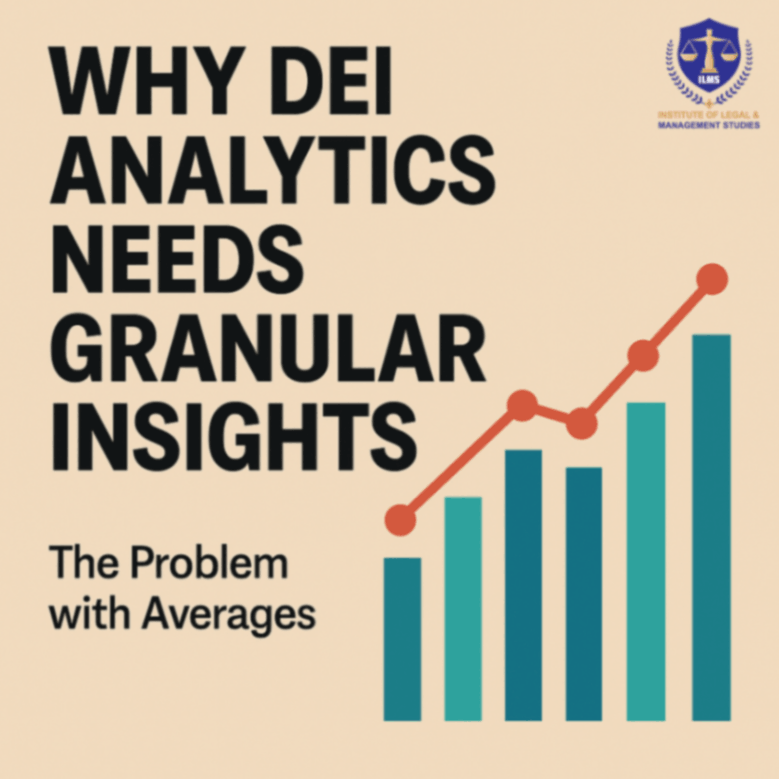
3. The Problem with Averages in DEI
3.1 The Tyranny of Averages
The concept of the “tyranny of averages” refers to how mean values can distort reality by concealing variation and inequality. When organizations summarize DEI outcomes using averages, they may present a misleadingly positive view of workplace inclusion.
Imagine measuring the average depth of a river to decide whether it’s safe to cross. If the average is 3 feet, one might assume it’s shallow—but certain parts may be 10 feet deep. Similarly, saying the average pay gap is “only” 2% might ignore significant disparities in individual teams or roles.
Averages flatten nuance. They create a false sense of uniformity and hide the outliers—the employees who may be struggling or thriving differently due to their unique identities. In DEI analytics, this is especially dangerous because outliers often signal where systemic biases are embedded.
3.2 How Averages Hide Inequities
Using averages masks the lived experiences of underrepresented or marginalized groups. A few examples:
- Pay equity: A company may claim gender pay parity, but that could be because women are overrepresented in junior roles and underrepresented in senior ones. The average may balance out, but inequity persists.
- Promotion rates: On average, promotions may seem balanced across groups. However, disaggregated data might show that White employees are promoted twice as quickly as Black or Latino employees.
- Exit reasons: Average engagement scores might be high, yet LGBTQ+ employees may be leaving due to microaggressions or lack of inclusion, which are not captured in aggregated surveys.
These examples show that average metrics act like frosted glass—they blur what’s behind and prevent organizations from seeing clearly.
3.3 Examples of Misleading Aggregate Data
Let’s look at some hypothetical yet realistic scenarios:
- A tech company proudly reports that 50% of its workforce is female. But a closer look reveals that women make up 70% of HR and admin teams, and only 15% of engineering. In senior technical roles, they constitute less than 5%. The average representation figure is technically correct but functionally misleading.
- A multinational bank shows an average pay gap of 1.5%. However, deeper analysis reveals that the gap is close to 0% for men and women in support roles but spikes to 18% in revenue-generating departments. This discrepancy drives long-term inequity and erodes trust.
- An inclusion survey reports a company-wide average engagement score of 82%. Yet, when filtered by race, the score drops to 58% for Black employees and 60% for Hispanic employees. These disparities indicate deeper cultural problems masked by the average.
3.4 Organizational Risks of Oversimplified Metrics
Relying on averages in DEI analytics isn’t just an analytical oversight—it’s a strategic liability. Here’s why:
- False confidence: Leaders may believe they’re making progress when disparities still persist under the surface.
- Missed accountability: Managers or departments that perpetuate inequities escape scrutiny due to aggregate reporting.
- Inadequate solutions: Programs are designed based on a flawed understanding of problems, leading to ineffective interventions.
- Reputational risk: Stakeholders—including employees, media, and regulators—expect transparency and detail. Inaccurate portrayals of progress can damage credibility.
- Employee distrust: When lived experiences contradict reported data, employees may disengage or exit, leading to cultural decline.
In short, oversimplification compromises the effectiveness, ethics, and impact of DEI strategies. The solution lies in embracing data granularity.
4. What Are Granular Insights?
4.1 Definition and Scope
Granular insights refer to highly detailed, disaggregated, and context-specific data that enable organizations to understand the unique experiences of individuals and subgroups within the workforce. Unlike high-level averages that generalize, granular data reveals disparities and variations that exist across roles, locations, departments, and identity intersections.
In DEI analytics, granularity means breaking down data into smaller, more precise units. For instance, instead of measuring overall gender diversity, organizations examine diversity among women in senior engineering roles, or representation of Black women in leadership across business units. This level of specificity allows for targeted, effective decision-making.
- Certificate Course in Labour Laws
- Certificate Course in Drafting of Pleadings
- Certificate Programme in Train The Trainer (TTT) PoSH
- Certificate course in Contract Drafting
- Certificate Course in HRM (Human Resource Management)
- Online Certificate course on RTI (English/हिंदी)
- Guide to setup Startup in India
- HR Analytics Certification Course
Granular insights are not just about “more data.” They’re about meaningful segmentation—the kind of segmentation that uncovers inequity, drives behavioral change, and enables equitable growth.
4.2 Levels of Granularity (Individual, Team, Location, Department)
Granularity in DEI analytics can occur at various levels:
- Individual level: Personal experiences collected through surveys, interviews, or self-ID data, enabling hyper-personalized inclusion strategies.
- Team level: Analysis of team dynamics, representation, and collaboration patterns that may impact inclusion or exclusion.
- Departmental level: Exploring DEI performance across business units (e.g., finance, tech, HR) helps identify functional cultures or leadership biases.
- Location/Region level: Cultural and legal contexts differ by geography, affecting how DEI manifests. Granular location data uncovers regional gaps in policy implementation or representation.
- Organizational level: Looking across the hierarchy (entry-level to executive), tenure, and employment type to detect structural barriers.
Granular analysis across these levels empowers leaders to craft data-driven strategies that fit the unique needs of every unit rather than applying blanket solutions.
4.3 Benefits of Intersectional and Demographic Segmentation
Granular DEI analytics becomes truly powerful when viewed through an intersectional lens. Intersectionality recognizes that individuals have multiple, overlapping identities (e.g., a queer Black woman with a disability) that affect how they experience the workplace.
Benefits of using intersectional and demographic segmentation include:
- Clarity on compounded inequities: Some groups face layered challenges that are not visible in single-axis analysis (e.g., analyzing just gender or race).
- Increased empathy and representation: By surfacing the experiences of smaller, often overlooked groups, organizations cultivate a culture of visibility and belonging.
- More equitable policies: Interventions designed with intersectional data are more inclusive and avoid one-size-fits-all pitfalls.
- Enhanced precision in measuring impact: Intersectional segmentation allows organizations to track how policies affect different subgroups—ensuring no one is left behind.
For example, analyzing promotion rates by race alone might show minimal disparity, but analyzing by race and gender together might reveal that Black women face unique hurdles compared to Black men or White women.
4.4 Visualizing Granular Data
Visualizing granular DEI data is key to turning complex patterns into understandable insights. Effective visualization techniques include:
- Heatmaps: Great for spotting disparities across departments, levels, or geographies.
- Intersectional bar charts: Show variations across multiple identity axes (e.g., race × gender).
- Cohort analysis: Tracks how different groups progress through hiring, promotion, and retention over time.
- Drill-down dashboards: Interactive dashboards that let users explore data from a high-level view down to individual categories or units.
- Sentiment layering: Mapping survey data over demographic data to highlight variations in experience or engagement.
The goal of visualizing granular data is not just to display statistics—it’s to inspire action through clarity and specificity.
5. Why Granular Insights Are Crucial for DEI
5.1 Understanding Unique Employee Experiences
Every employee experiences the workplace differently based on their identity, background, and role. Granular DEI analytics recognizes this and helps organizations capture the lived reality of their people. Instead of assuming inclusion is universal, granular insights illuminate where inclusion is thriving—and where it is not.
For example, women in engineering may report a high sense of belonging, but when the data is segmented by age or tenure, younger women or new hires may feel less supported. Similarly, employees with disabilities might struggle with accessibility in specific locations even if overall feedback appears positive.
By drilling down into these unique experiences, leaders can move from generic inclusion initiatives to tailored support that addresses the specific pain points of different communities.
5.2 Detecting Hidden Barriers and Systemic Bias
Granular data helps uncover patterns of exclusion that are otherwise hidden by aggregates. This includes:
- Bias in hiring processes: Certain identities may drop off disproportionately at specific recruitment stages.
- Unequal access to promotions: Intersectional data may show that only certain demographics are advancing in leadership pipelines.
- Skewed feedback and performance reviews: Detailed analysis might reveal unconscious bias in manager ratings across different groups.
- Geographic disparities in inclusion: Offices in one region might be inclusive, while another location has persistent engagement gaps among minority groups.
These barriers are often subtle but systemic. Granular insights make them visible, measurable, and solvable.
5.3 Enhancing Talent Acquisition and Retention Strategies
Granular DEI analytics informs smarter talent strategies by helping organizations understand:
- Where diverse talent is lost: Are candidates from marginalized backgrounds dropping out during screening or interview stages?
- Why people leave: Are certain demographics leaving due to culture, lack of progression, or discrimination?
- What retention strategies work: Which interventions (mentorship, sponsorship, flexible policies) yield higher engagement or retention for specific groups?
With this clarity, companies can move from reactive strategies (e.g., diversity hiring drives) to proactive, sustained talent development programs that support inclusion throughout the employee lifecycle.
5.4 Informing Inclusive Policy-Making
Policies that work for the majority may unintentionally disadvantage minorities. Granular insights provide the evidence base needed to:
- Design inclusive benefits: For example, LGBTQ+ employees may need different family leave policies or mental health coverage.
- Adjust flexibility models: Employees with disabilities or caregiving responsibilities may benefit from remote work arrangements more than others.
- Ensure fair pay practices: Intersectional pay audits can help close equity gaps that are invisible in average-level reviews.
- Improve accessibility and accommodations: Regional or role-based differences in accessibility needs become clearer with detailed data.
Ultimately, granular insights guide organizations toward equity—ensuring fairness for all, not just most.
6. Case Studies: When Granular DEI Data Made the Difference
6.1 Case Study: A Tech Company Tackling Pay Inequity
A leading global tech firm conducted an annual gender pay audit and found only a 1.8% average gap. The leadership was initially satisfied with the progress. However, the DEI analytics team segmented the data further—by department, level, location, and tenure.
What they found was striking:
- Women in R&D roles were paid 11% less than men.
- The gap widened to 17% in leadership positions in the U.S.
- In Asia-Pacific regions, women managers were earning less than newly hired male employees.
Armed with this insight, the company initiated:
- Targeted compensation corrections
- Transparent pay bands
- Sponsorship programs for mid-level women in tech
Within 18 months, not only was the pay gap reduced, but internal promotions for women in technical roles rose by 30%.
6.2 Case Study: Intersectional Analytics in Hiring
A fintech startup had made strong commitments to racial diversity. They tracked hiring data and proudly reported that 40% of their new hires were from underrepresented racial backgrounds. However, turnover remained high among minority hires.
Granular hiring analysis revealed:
- Women of color were disproportionately screened out during technical assessments.
- Candidates identifying as LGBTQ+ of color faced longer interview cycles and lower offer rates.
- The onboarding experience was less positive for non-binary and disabled employees.
In response, the startup:
- Redesigned hiring rubrics for fairness
- Trained interviewers on intersectional bias
- Created mentorship circles for new hires by identity and function
One year later, offer rates and retention improved significantly for marginalized groups.
6.3 Case Study: DEI Dashboards in a Global Enterprise
A Fortune 100 manufacturing company implemented an enterprise-wide DEI dashboard with granular segmentation across 40 countries. While global data suggested steady diversity progress, the granular dashboard revealed:
- Severe underrepresentation of women in plant operations in Latin America
- Engagement scores 25% lower among frontline Black employees in North America
- Higher attrition of LGBTQ+ employees in regions lacking non-discrimination protections
The dashboard empowered local leaders to:
- Partner with regional NGOs for hiring pipelines
- Invest in bias training for operations managers
- Launch a global allyship network tailored by region
Granular insights enabled scalable, context-specific DEI interventions—leading to increased representation, engagement, and retention worldwide.
6.4 Lessons Learned from Each Scenario
Across these case studies, several themes emerge:
- Averages were misleading: Surface-level metrics masked real problems.
- Granularity enabled precision: Targeted interventions were possible only with detailed insights.
- Intersectionality was critical: Understanding layered identities revealed the complexity of exclusion.
- Dashboards became strategic tools: Data moved beyond HR to influence company-wide behavior.
These lessons confirm the central thesis: without granularity, DEI analytics is incomplete. With it, organizations gain the power to act responsibly, fairly, and effectively.
7. Implementing Granular DEI Analytics in Practice
- Certificate Course in Labour Laws
- Certificate Course in Drafting of Pleadings
- Certificate Programme in Train The Trainer (TTT) PoSH
- Certificate course in Contract Drafting
- Certificate Course in HRM (Human Resource Management)
- Online Certificate course on RTI (English/हिंदी)
- Guide to setup Startup in India
- HR Analytics Certification Course
7.1 Building the Right Data Infrastructure
To leverage the full power of granular DEI analytics, organizations must first build a data infrastructure capable of capturing, storing, processing, and analyzing highly segmented demographic and behavioral information. This means integrating multiple data systems—from HRIS to ATS to survey platforms—into a centralized, secure data warehouse or dashboard.
Key elements of the right infrastructure include:
- Scalable Data Models: Systems that allow for data disaggregation across multiple variables such as gender, race, sexual orientation, disability status, job level, location, etc.
- Data Integration Pipelines: APIs or connectors that unify data from recruitment, onboarding, learning management, payroll, and performance systems.
- Custom Analytics Dashboards: Visualization platforms that offer drill-down features for DEI stakeholders, from executives to ERG leaders.
- Automated Reporting: Scheduled, real-time, or self-service reports that allow for ongoing monitoring rather than periodic audits.
- Security and Compliance Systems: Data governance frameworks to manage access, audit logs, encryption, and compliance with local/global data protection laws.
Building this infrastructure is not a one-time IT project—it is an evolving foundation that supports inclusive decision-making and cultural transformation.
7.2 Collecting Intersectional and Self-ID Data
Granular DEI analytics depends on rich, self-reported identity data. To achieve this:
- Self-Identification Campaigns: Employees should be invited (not mandated) to voluntarily disclose race, ethnicity, gender identity, sexual orientation, disability status, veteran status, and more.
- Inclusive Questionnaires: Language must be culturally sensitive, non-binary, and offer options for write-ins or “prefer not to say” responses.
- Multiple Collection Channels: Surveys, onboarding forms, intranet portals, or employee profiles can serve as touchpoints for self-ID updates.
- Ongoing Data Refresh: Identity is dynamic. Annual or biannual updates allow for more accurate, current representation in analytics.
Importantly, employees must understand why data is being collected and how it will be used. When transparency and trust are embedded into the process, response rates improve and data quality strengthens.
7.3 Privacy, Consent, and Ethical Collection
Collecting sensitive data introduces a serious ethical obligation to protect employee privacy and autonomy. Organizations must follow a framework built on three key pillars:
- Informed Consent: Employees must be told what data is being collected, why it’s needed, how it will be used, and who will see it—before they opt in.
- Anonymization and Aggregation: Individual identities must be masked unless absolutely necessary, especially when analyzing sensitive combinations (e.g., LGBTQ+ women in a team of five).
- Minimal Access and Role-Based Permissions: Only approved personnel should access identity-level data, with audit trails and usage restrictions.
- Legal Compliance: Adherence to GDPR, CCPA, HIPAA (where applicable), and internal privacy policies is non-negotiable.
- Ethical Review Boards: Some companies establish data ethics committees to review proposed uses of identity data, ensuring alignment with DEI goals and human rights values.
Ethical DEI analytics must strike a delicate balance between visibility and vulnerability—ensuring that the pursuit of equity never compromises personal dignity.
7.4 Training Teams to Interpret and Use Data
Granular data is only powerful when people know how to read, interpret, and act on it. Organizations must invest in upskilling various stakeholders:
- HR and People Analytics Teams: Training in statistical literacy, bias detection, intersectional analysis, and ethical data handling.
- Leaders and Managers: Coaching to interpret dashboards, understand what disparities mean, and implement inclusive team practices based on data insights.
- ERG Leaders and DEI Councils: Empowering community representatives to advocate for change using credible evidence.
- Communications Teams: Equipping them to report DEI data responsibly without diminishing nuance or over-simplifying results.
By democratizing access to insights—and teaching people how to use them—granular DEI analytics becomes embedded into everyday decision-making rather than confined to annual reports.
8. Challenges in Granular DEI Analytics
8.1 Data Gaps and Collection Barriers
One of the most common hurdles in granular DEI analytics is incomplete or uneven data. This can stem from:
- Low Self-ID Rates: Employees may be hesitant to share sensitive identity information.
- Lack of Historical Data: Many organizations only recently began collecting DEI metrics in earnest.
- System Incompatibility: Legacy HR systems may not support fields for gender identity or race segmentation.
- Non-standard Definitions: Different regions may categorize race/ethnicity differently, complicating global rollups.
To address these gaps, companies must adopt an iterative approach—acknowledging limitations while continuously improving data collection processes.
8.2 Balancing Privacy with Transparency
While transparency builds trust, too much detail—especially for small subgroups—can risk “outing” individuals. This leads to ethical dilemmas:
- Over-Segmentation: Breaking data down too finely may make individuals identifiable (e.g., one Black woman in a team of five).
- Public Reporting Risks: Sharing intersectional data externally must be done cautiously to avoid reputational harm or legal exposure.
- Cultural Differences: In some countries, collecting or disclosing identity data may be discouraged or even illegal.
Solutions include data suppression thresholds (e.g., no public segmentation with <10 individuals), internal-only dashboards, and clear documentation of data limitations.
8.3 Resistance to Change and Cultural Sensitivities
DEI analytics initiatives—especially granular ones—may encounter pushback:
- Managerial Defensiveness: Leaders may resist data that reflects poorly on their teams or suggests systemic bias.
- Fear of Misuse: Employees worry that identity data could be used for targeting or discrimination.
- Cultural Taboo: In some contexts, discussing race, sexuality, or gender identity is culturally uncomfortable or politically sensitive.
Navigating these challenges requires strong change management, executive modeling of transparency, and a focus on the business case for inclusive analytics.
8.4 Technical and Organizational Limitations
Even with good intentions, some companies lack the technical maturity or organizational alignment to implement granular DEI analytics. Common constraints include:
- Understaffed People Analytics Teams: Especially in smaller firms, DEI analytics may be deprioritized.
- Insufficient Budget: Investing in DEI platforms, consultants, or training requires financial commitment.
- Data Silos: When HR, IT, and DEI teams don’t collaborate, data remains fragmented and underutilized.
- Lack of Leadership Buy-In: Without senior sponsorship, granular insights rarely lead to sustained change.
Overcoming these barriers demands a long-term vision where DEI analytics is treated not as an optional report—but as a strategic necessity.
9. Best Practices and Strategic Recommendations
9.1 Moving from Reporting to Action
Collecting data is only step one. The real power of granular insights lies in how organizations act on them.
- Set Clear Benchmarks: Define what progress looks like for specific groups (e.g., doubling women of color in technical leadership within 3 years).
- Tie Data to Decision-Making: Use granular insights in performance reviews, promotion discussions, and policy creation.
- Create Accountability Mechanisms: Hold managers and leaders responsible for closing representation or inclusion gaps.
- Enable Grassroots Mobilization: Let ERGs use granular data to propose solutions and measure impact.
Instead of simply reporting disparities, organizations must resource the changes needed to fix them.
9.2 Customizing Metrics for Organizational Context
There is no universal DEI dashboard. Best-in-class organizations:
- Align Metrics with Business Objectives: For a global company, location-based gender equity may matter more. For a startup, early pipeline diversity might be critical.
- Adapt to Industry Norms: The challenges in tech (e.g., gender in engineering) differ from those in healthcare (e.g., racial disparities in patient-facing roles).
- Use Mixed Methods: Quantitative data should be paired with qualitative insights—focus groups, exit interviews, and listening sessions—for fuller understanding.
Customization ensures that DEI analytics are relevant, actionable, and resonant with the organization’s unique challenges.
9.3 Fostering Accountability Across Teams
Accountability is the bridge between insight and impact. Organizations should:
- Embed DEI KPIs into Business Units: Diversity goals shouldn’t just sit with HR—they must be owned by departments.
- Make Results Visible: Publish internal dashboards that show representation, sentiment, and progression by group and function.
- Reward Inclusive Leadership: Recognize managers and teams that move the needle through mentoring, hiring, and allyship.
- Enable Peer Benchmarking: Let teams compare progress, share strategies, and motivate each other.
When everyone is responsible for DEI outcomes, cultural transformation accelerates.
9.4 Continuous Learning Through Feedback Loops
Granular analytics is not a one-time exercise—it’s an evolving journey. Companies that succeed:
- Use Pulse Surveys: Regular check-ins to gauge sentiment across identity intersections.
- Re-evaluate KPIs Annually: As new identity groups emerge or workforce demographics shift, metrics must adapt.
- Encourage Open Dialogue: Data is just the starting point. Real insight comes from listening to the voices behind the numbers.
- Invest in Learning: Offer ongoing education on DEI trends, tools, and ethical analytics to build long-term capability.
A culture of learning ensures that DEI strategies remain agile, relevant, and impactful in a changing world.
10. The Future of DEI Analytics
10.1 AI, Predictive Analytics, and Bias Prevention
As technology evolves, so does the landscape of DEI analytics. Artificial Intelligence (AI) and machine learning (ML) are increasingly being integrated to generate predictive insights that move beyond descriptive reports. For example, algorithms can now:
- Predict attrition risk for underrepresented employees.
- Identify biased language in job descriptions.
- Forecast inclusion outcomes based on policy changes.
- Detect patterns in promotion rates across intersectional identities.
However, while these tools hold immense potential, they must be approached with caution. AI systems are only as unbiased as the data they're trained on. If historical data reflects discriminatory practices, the algorithms may reinforce rather than rectify bias.
The future of DEI analytics, therefore, demands ethical AI governance—frameworks that regularly audit algorithms, include diverse data sets, and prioritize fairness, transparency, and explainability. AI should not replace human judgment but augment it, offering a scalable way to spot hidden inequities early and at scale.
10.2 Integrating Qualitative Insights with Quantitative Metrics
- Certificate Course in Labour Laws
- Certificate Course in Drafting of Pleadings
- Certificate Programme in Train The Trainer (TTT) PoSH
- Certificate course in Contract Drafting
- Certificate Course in HRM (Human Resource Management)
- Online Certificate course on RTI (English/हिंदी)
- Guide to setup Startup in India
- HR Analytics Certification Course
One of the most critical frontiers in DEI analytics is the meaningful integration of qualitative data. Numbers alone cannot fully explain experiences like microaggressions, exclusionary behavior, or psychological safety. To truly capture the lived realities of marginalized employees, organizations must:
- Pair dashboards with open-ended survey responses.
- Conduct focus groups or one-on-one interviews segmented by identity groups.
- Analyze sentiment in employee forums, exit interviews, and ERG discussions.
Emerging tools in Natural Language Processing (NLP) can help scale and systematize this integration. However, qualitative insights require thoughtful interpretation—often best done in collaboration with DEI experts, community representatives, and cultural consultants.
Blending numbers with narratives ensures that DEI strategies are not just data-driven, but also human-centered.
10.3 Evolving Expectations from Stakeholders
The expectations surrounding DEI transparency and accountability are rising across all stakeholder groups:
- Employees want clarity on how companies are tackling systemic barriers and measuring progress.
- Customers and Clients increasingly choose brands aligned with equity and social justice.
- Investors now demand Environmental, Social, and Governance (ESG) metrics—of which DEI is a core component.
- Regulators in various countries are exploring legislation that mandates public reporting on workplace diversity.
This shift means DEI analytics must evolve from internal reporting to robust, stakeholder-facing communication. Organizations that lead with data-backed storytelling—highlighting challenges, progress, and learning—will earn deeper trust and brand loyalty.
10.4 Building a Culture of Evidence-Based Inclusion
The ultimate goal of granular DEI analytics is not better spreadsheets—it’s a better workplace. A future-oriented DEI strategy embeds analytics into the cultural fabric of the organization through:
- Inclusive Decision-Making: Using granular insights to shape everything from hiring panels to product design.
- Adaptive Leadership: Equipping leaders with data to manage inclusively and course-correct when gaps emerge.
- Transparent Communication: Sharing progress and pitfalls openly to invite collective ownership.
- Continuous Experimentation: Piloting new programs, measuring impact, and iterating based on feedback and evidence.
In this culture, inclusion is no longer an abstract ideal—it becomes a series of measurable, actionable, and trackable commitments.
11. Conclusion
11.1 Rethinking Inclusion Through Precision
In an era defined by complexity, averages are no longer good enough. Inclusion cannot be measured—or achieved—through broad categories and blanket policies. Instead, the path to equity requires precision: a detailed, nuanced, and intersectional understanding of how different groups experience the workplace.
Granular DEI analytics allows organizations to do exactly that. It brings clarity where there was once obscurity, specificity where there was once generalization, and accountability where there was once ambiguity.
11.2 Why Granular Insights Drive Real Change
Organizations that invest in granular analytics are better equipped to:
- Identify root causes of disparities rather than surface symptoms.
- Tailor interventions to the unique needs of different communities.
- Track progress with rigor and transparency.
- Earn trust by demonstrating a commitment to data-backed inclusion.
These are not just operational advantages—they are strategic imperatives in a world where talent, innovation, and reputation are increasingly tied to equity.
Granular insights don't just help organizations understand what's wrong—they illuminate what to do next.
11.3 Final Thoughts: Toward a Data-Empowered DEI Strategy
As the conversation around DEI matures, so too must the tools we use to drive it. The future belongs to organizations that move beyond performative metrics and invest in granular, ethical, and actionable analytics. By doing so, they don't just report on diversity—they build inclusion, operationalize equity, and create workplaces where every individual truly belongs.
This shift isn’t easy. It requires bold leadership, ethical foresight, and technological evolution. But the reward is profound: a culture where differences are not only recognized but respected, supported, and celebrated—at every level, in every corner, for everyone.
Frequently Asked Questions (FAQ)
Q1. What is meant by “granular insights” in DEI analytics?
A: Granular insights refer to detailed, disaggregated data that goes beyond broad averages to highlight patterns across various demographic and identity groups. This includes breaking down data by race, gender identity, sexual orientation, age, disability status, location, department, and more—often in intersectional combinations. Granular insights help reveal nuanced inequities that may be hidden in aggregate metric.
Q2. Why are averages problematic in DEI measurement?
A: Averages can obscure significant disparities within subgroups. For example, a company may report that 50% of its workforce is women—but without granular data, it could hide that very few women are in leadership, or that Black and Hispanic women are underrepresented or face higher attrition rates. Averages create a false sense of equity and often mask systemic barriers.
Q3. What types of data are typically used in DEI analytics?
A: DEI analytics often utilize both quantitative data (e.g., demographics, recruitment numbers, promotion rates, pay equity, turnover) and qualitative data (e.g., employee surveys, focus groups, exit interviews). Modern DEI analytics also integrate self-ID data, sentiment analysis, and intersectional breakdowns to understand experiences more deeply.
Q4. Is it legal to collect data on race, gender identity, and sexual orientation in the workplace?
A: In many countries, yes—but it must be collected ethically, voluntarily, and with informed consent. Privacy laws like GDPR (in the EU) or CCPA (in California) regulate how sensitive employee data can be gathered and used. It’s important to ensure transparency, data protection, and compliance with local regulations while collecting self-ID information.
Q5. How do granular insights help organizations take action?
A: Granular insights enable organizations to:
- Pinpoint exactly where inequities occur (e.g., pay gaps among specific subgroups).
- Tailor interventions (e.g., mentorship for underrepresented technical roles).
- Track progress over time and hold leaders accountable.
- Design inclusive policies based on real employee experiences rather than assumptions.
They transform DEI from an abstract ideal into a measurable, operational goal.
Q6. What are the risks or challenges in using granular DEI analytics?
A: Key challenges include:
- Ensuring privacy and confidentiality of sensitive identity data.
- Gaps in self-reported data or underreporting.
- Technical limitations in legacy systems.
- Cultural resistance or lack of stakeholder buy-in.
These can be overcome with a combination of ethical frameworks, clear communication, strategic investment, and employee trust-building.
Q7. What’s the role of AI and predictive analytics in DEI?
A: AI can enhance DEI analytics by identifying trends, forecasting risk (e.g., likely attrition of underrepresented groups), or detecting biased patterns in hiring or performance. However, it must be carefully managed to avoid replicating historical bias. Responsible AI in DEI requires transparency, auditing, and fairness safeguards to ensure it serves inclusion—not discrimination.
Q8. Can small or mid-sized companies benefit from granular DEI analytics?
A: Absolutely. Even if smaller companies lack enterprise-level tools, they can still collect meaningful data through surveys, self-ID forms, and small-scale dashboards. The key is to start with relevant metrics, engage employees in the process, and commit to using data for continuous improvement, not just compliance.
Q9. How often should organizations collect and review DEI data?
A: Ideally, DEI data should be reviewed quarterly or biannually, depending on the maturity of the program and size of the workforce. Self-ID data may be refreshed annually. Continuous pulse surveys and periodic qualitative interviews can help track shifts in sentiment and workplace climate in real time.
Q10. How can organizations communicate DEI insights responsibly?
A: Responsible DEI communication means:
- Reporting data transparently without over-simplifying.
- Sharing context and limitations alongside statistics.
- Protecting confidentiality, especially for small sample groups.
- Framing data within the organization’s ongoing DEI journey.
The goal is to build trust, invite accountability, and engage all stakeholders in meaningful change.
- Certificate Course in Labour Laws
- Certificate Course in Drafting of Pleadings
- Certificate Programme in Train The Trainer (TTT) PoSH
- Certificate course in Contract Drafting
- Certificate Course in HRM (Human Resource Management)
- Online Certificate course on RTI (English/हिंदी)
- Guide to setup Startup in India
- HR Analytics Certification Course